Numbers in spreadsheets tell part of the story. AI call analytics visualizations tell the rest - the part your brain actually processes quickly. When you see a bright spot on a heatmap at Monday 6 PM, you do not need statistical training to understand that is when phones ring off the hook.
The Analytics screen transforms raw call data into patterns you can act on. Not theoretical patterns buried in pivot tables, but visual patterns that jump off the screen and demand attention.
What makes this particularly valuable for tour and activity businesses is the immediacy. You are not waiting for monthly reports from a marketing agency. Patterns emerge in real-time.
Call Volume Heatmap Analysis
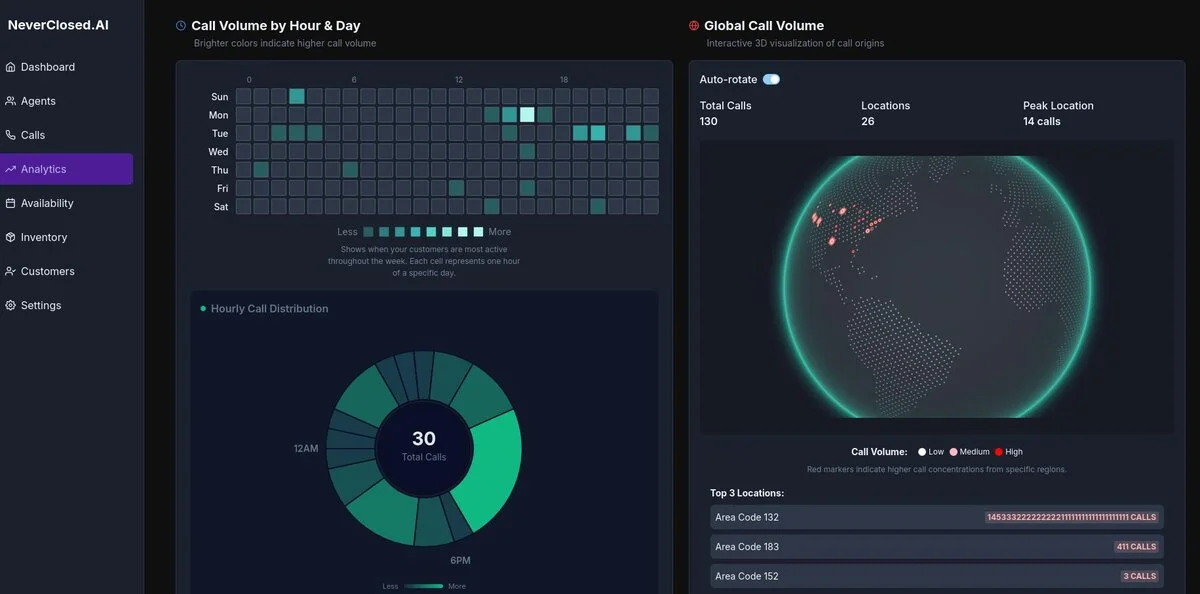
The heatmap shows every hour of every day in a color-coded matrix. Instantly identify your busiest times without reading a single number.
Hour by Day Matrix
Visual grid showing call volume for every hour of every day. Your busiest times literally glow.
Color Intensity Scale
Brighter colors mean higher volume. Gradient from dark to bright cyan.
Pattern Recognition
Spot patterns instantly: lunch rushes, after-work spikes, weekend trends.
Mon 6PM PeakHover Details
Hover any cell for exact call count when you need specifics beyond the color coding.
Optimization Tip: Use the heatmap to staff human backup during peak hours. If calls spike at 6 PM on Mondays, ensure someone is available to handle transfers.
Hourly Call Distribution
Donut Chart Visualization
Circular chart with total calls in the center. Segments represent different time periods.
30 Total CallsTime Period Segments
Chart divided by meaningful time blocks. Segment sizes reflect actual call distribution.
Color-Coded Hours
Each time segment has distinct coloring for quick identification.
Interactive Segments
Click any segment to filter other charts to that time period.
Global Call Volume Geographic Display
Interactive 3D Globe
Rotating Earth visualization showing call origins with red and orange markers.
Auto-Rotate Toggle
Enable automatic rotation to see all regions or manually explore.
Auto-rotate ONTotal Calls Counter
Running total of visualized calls updating in real-time.
130 Total CallsUnique Locations
Count of distinct geographic origins tracking market reach.
26 LocationsPeak Location
Your highest-volume calling region with exact count.
14 calls from peakVolume Legend
Color key: Low (gray), Medium (cyan), High (red).
Top Locations Leaderboard
Area Code Rankings
Top three calling area codes with call counts for territory planning.
Visual Volume Bars
Bar graphs showing relative volume between regions.
Emerging Markets
Third-place locations might be emerging markets worth nurturing.
Analytics without visualization is like music without sound. The patterns in your call data exist whether you can see them or not. The Analytics screen makes them visible, obvious, and actionable.
For tour and activity businesses competing on customer experience, these insights separate leaders from followers. The visualizations reveal the behavioral patterns that determine business success.
Frequently Asked Questions
How does the system determine geographic location from phone calls?
Location is determined primarily from area codes and carrier data, providing approximate regional data accurate for market analysis.
Can I compare call patterns between different time periods?
Yes, the date range selector allows custom period comparisons including seasonal and year-over-year analysis.
How far back does the historical call analytics data extend?
Analytics data is retained for the full duration of your account enabling long-term trend analysis.
Can I set up automated alerts when call volume exceeds thresholds?
Yes, threshold alerts can be configured for hourly volume, daily totals, or sudden spikes.
Does the 3D globe visualization work on mobile devices?
Yes, the globe renders on modern smartphones though desktop viewing is recommended for detailed analysis.
How do I use this data to improve advertising spend?
Correlate call patterns with ad schedules to identify peak ROI periods and optimize budget allocation.