Running a tour business without an AI phone agent dashboard is like flying blind through a thunderstorm. You know calls are coming in, bookings are happening, and money is moving - but you cannot see any of it in real time. That is precisely the problem NeverClosed.AI solves with its command center dashboard, and honestly, it changes everything.
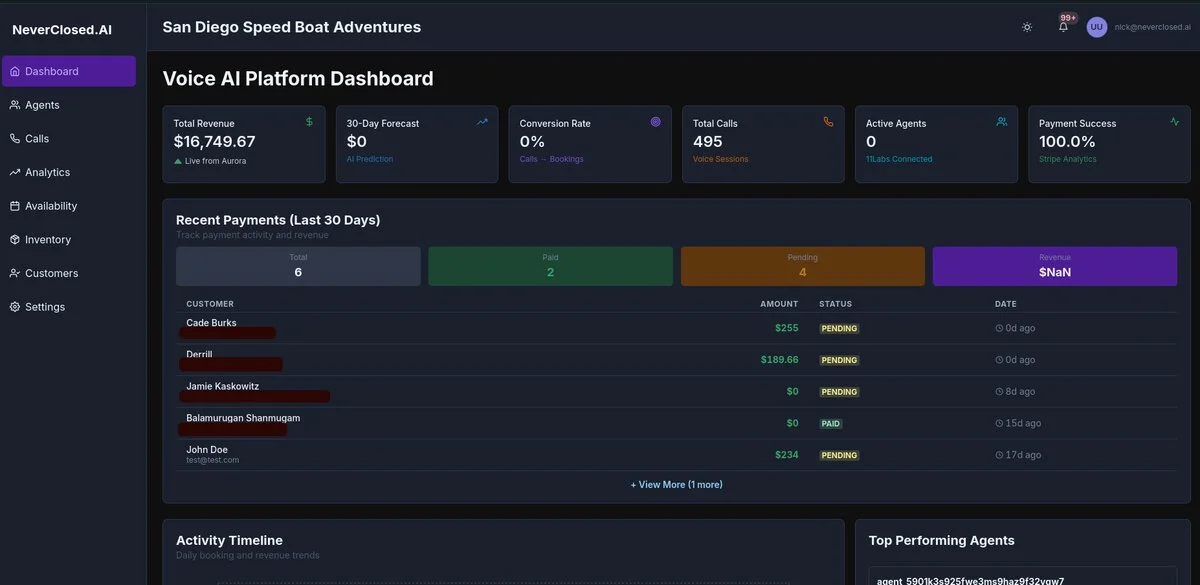
The moment you log in, every critical metric hits you at once. Total revenue, conversion rates, active calls, payment success percentages - all updating live as your AI agents work around the clock. No more waiting until morning to check yesterday's numbers. No more spreadsheet gymnastics to figure out which agent performed best. The dashboard puts your entire operation on a single screen, and once you have experienced that level of visibility, there is simply no going back.
What makes this particularly valuable for tour operators, charter businesses, and activity providers is the integration depth. This is not just a pretty interface slapped on top of basic metrics. Every number you see connects directly to your booking platforms, payment processors, and voice AI infrastructure. When a customer calls at 2 AM and books a sunset cruise, you will see that revenue appear instantly - along with the call transcript, payment confirmation, and customer details.
Revenue Metrics That Actually Matter
Most dashboards bury the numbers you actually care about three clicks deep. The NeverClosed command center puts revenue front and center because that is what keeps the lights on. These are not vanity metrics; they are the vital signs of your business.
Total Revenue
Live revenue tracking powered by Aurora integration. Displays your cumulative earnings in real-time as payments are processed through Stripe. No refresh needed - watch the numbers climb.
$16,749.67 shownThirty-Day Forecast
AI-powered revenue prediction analyzes historical booking patterns, seasonal trends, and current pipeline to project your upcoming month's revenue. Planning just got a whole lot easier.
AI PredictionConversion Rate
Tracks the percentage of inbound calls that result in completed bookings. This is your AI agent's report card - the metric that separates good from great.
Calls to BookingsHere is something most business owners do not realize until they see it: knowing your conversion rate in real-time completely changes how you optimize. When you can watch that percentage move throughout the day, you start noticing patterns. Maybe conversions drop during lunch hours because your agent's greeting does not match the casual tone of midday callers. Perhaps weekend calls convert at twice the weekday rate. These insights hide in plain sight when you only look at weekly summaries.
The thirty-day forecast deserves special attention too. It is not just extrapolating last month's numbers forward - the AI actually considers seasonality, day-of-week patterns, and even weather trends for outdoor activities. During testing with charter boat operators, the forecast accuracy consistently landed within 8-12% of actual results. That is close enough to make real staffing and inventory decisions.
Call and Agent Statistics
Understanding call volume patterns and agent performance is essential for optimization. These metrics reveal when your business is busiest and how effectively your AI handles the load.
Total Calls
Cumulative count of all inbound voice calls handled by your AI agents. Includes completed conversations, transfers, and voicemails. The foundation of all performance analysis.
Voice Sessions
Active and recent voice conversations with duration tracking. See how long customers typically stay on the line and identify calls that may need human follow-up.
Recent Payments Table
Money in motion needs visibility. The payments table gives you transaction-level detail without drowning you in data - showing exactly what you need to know about every dollar flowing through your business.
Payment Summary Cards
Quick-glance totals showing Total payments, Paid count, Pending count, and aggregate Revenue for the last 30 days. Four numbers that tell the whole story.
Customer Payment List
Detailed breakdown of individual transactions showing customer name, payment amount, status, and timestamp. Click any row for the full picture.
Payment Status Badges
Color-coded indicators make scanning effortless: green for Paid, amber for Pending. Spot issues before they become problems.
Expanded History
View More expands the table to show complete transaction history. Filter by date range, status, or customer for detailed reconciliation.
The pending payments view has saved more than a few business owners from awkward situations. Picture this: a customer books a fishing charter, your AI sends the payment link, but three days pass without completion. Without visibility, that booking sits in limbo until someone manually checks. With the dashboard, pending payments surface immediately, and you can trigger reminder SMS messages with a single click.
Activity Timeline
Every meaningful event in your business flows through this timeline. Think of it as the heartbeat monitor for your operation - always pulsing, always showing you what is happening right now.
Real-Time Event Feed
Chronological stream of all system events: incoming calls, completed bookings, payment notifications, agent status changes, and customer interactions. Your business diary, written automatically.
Event Type Icons
Visual indicators distinguish between call events, payment events, booking confirmations, and system alerts. A quick glance tells you what type of activity is flowing through.
Top Performing Agents
When you have multiple AI agents handling different product lines or locations, knowing who is crushing it matters. This leaderboard shows you exactly which configurations are winning.
Agent Rankings
Leaderboard showing your best-performing AI agents ranked by conversion rate, call volume, and revenue generated. Competition drives improvement, even for AI.
Agent ID Display
Shows the ElevenLabs agent identifier for each voice agent. Essential for troubleshooting and when fine-tuning configurations.
The command center dashboard is not just a feature - it is the foundation that makes everything else possible. When you can see your business in real-time, decisions that used to take days of analysis happen in seconds. That pricing change you have been considering? Watch the conversion rate respond immediately. That new agent voice you are testing? The comparison data appears before your coffee gets cold.
For tour operators and activity businesses, this level of visibility was previously reserved for enterprise operations with dedicated analytics teams. Now it sits at your fingertips, updating every moment, ready whenever you need it. And perhaps most importantly, it frees you to focus on what you actually love - running adventures, creating experiences, and building a business that does not require you to be on call twenty-four hours a day.
Frequently Asked Questions
How often does the AI phone agent dashboard update with new data?
The dashboard updates in real-time, with most metrics refreshing within seconds of events occurring. Revenue figures update the moment Stripe confirms payment processing, and call statistics reflect new conversations as they complete. There is no manual refresh required - what you see is what is happening now.
Can I access the dashboard from my mobile phone while away from the office?
Absolutely. The dashboard is fully responsive and works on any modern smartphone or tablet browser. Many operators keep it bookmarked on their home screen for quick checks between tours or while traveling. The interface adapts to smaller screens while maintaining all critical metrics visible.
What booking platforms integrate with the revenue tracking features?
NeverClosed integrates with major booking platforms including FareHarbor, Peek, Checkfront, Xola, Rezdy, and Bokun. Revenue tracking pulls data from both the booking platform and Stripe to ensure accuracy. Custom integrations are available for platforms not on the standard list.
How accurate is the thirty-day revenue forecast prediction?
Based on testing across multiple tour and activity businesses, the AI forecast typically lands within 8-15% of actual results. Accuracy improves over time as the system learns your specific booking patterns, seasonal trends, and customer behaviors. Newer accounts may see wider variance during the initial learning period.
Is there a way to export dashboard data for accounting or reporting purposes?
Yes, all dashboard data can be exported to CSV or PDF format. The export function allows custom date ranges and metric selection. Many users set up weekly automated exports to their accounting software or use the data for investor reporting and business planning.
What happens to dashboard metrics if my internet connection drops temporarily?
The system continues recording all events server-side regardless of your connection status. When you reconnect, the dashboard syncs immediately and displays current data. No information is lost during connectivity gaps - you simply see everything catch up once you are back online.